The Bitcoin (BTC) price and the Crypto Market Cap (TOTALCAP) created lower highs yesterday. KuCoin Token (KCS) failed to close above an important horizontal resistance area.
In the news today:
TOTALCAP Creates Lower High
Since October, the cryptocurrency market cap has increased rapidly alongside an ascending support trend line. The upward movement culminated with a high of $1.63 trillion on December 9. However, the crypto market went down afterward, accelerating its decrease on December 11.
Market traders use the RSI as a momentum indicator to identify overbought or oversold conditions and to decide whether to accumulate or sell an asset. Readings above 50 and an upward trend indicate that bulls still have an advantage, whereas readings below 50 suggest the opposite.
The decrease was preceded by a bearish divergence (green) in the daily RSI. A bearish divergence occurs when a momentum decrease accompanies a price increase. It often leads to bearish reversals, as was the case with TOTALCAP.
While TOTALCAP bounced at the trend line on December 13, it created a lower high yesterday. If TOTALCAP breaks down from the ascending support trend line, it can fall by another 12% to the 0.382 Fib retracement support level at $1.38 trillion.
Despite this bearish TOTALCAP price prediction, a movement above the yearly high of $1.63 trillion will mean the correction is complete. A 20% increase to the next resistance at $1.90 trillion will be likely in that case.
Read More: 9 Best AI Crypto Trading Bots to Maximize Your Profits
Bitcoin Gets Rejected at Resistance
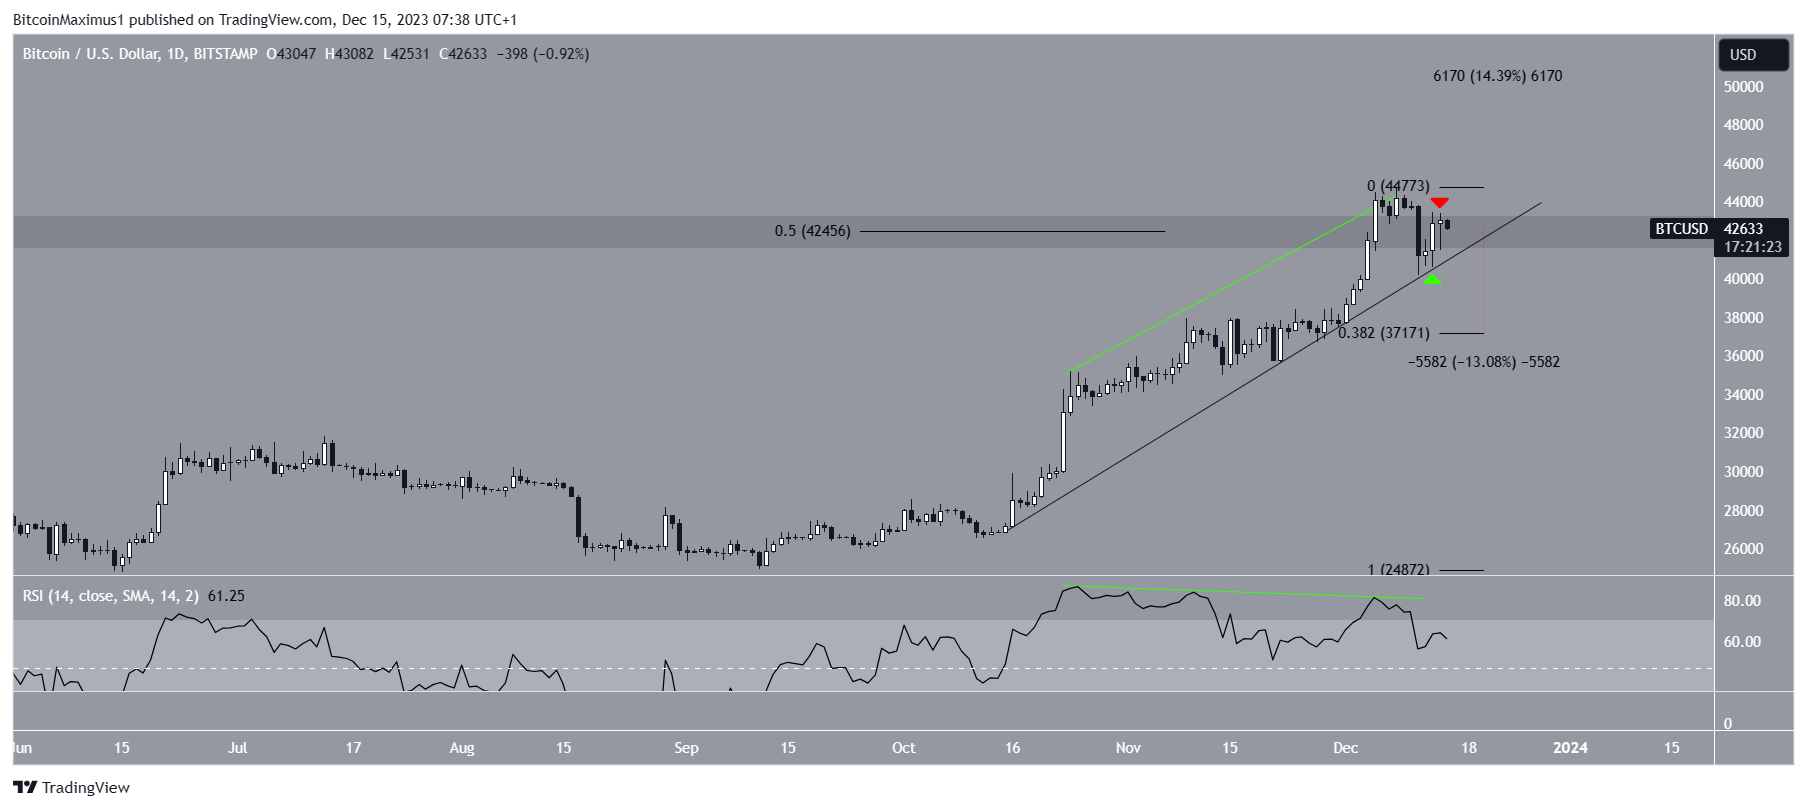
Similarly to TOTALCAP, the BTC price has increased alongside an ascending support trend line since October. The increase culminated with a new yearly high of $44,730 on December 8.
The price fell afterward, accelerating its decrease on December 11. The entire drop preceded a bearish divergence in the daily RSI (green).
A critical development in the Bitcoin price is that it deviated above the 0.5 Fib retracement resistance level at $42,450 (red circle). Whether it reclaims this level or resumes its descent will determine the future trend.
While the BTC price bounced on December 13, it created a lower high inside the resistance area. If the BTC price breaks down from the support trend line, it can fall by 13% and reach the 0.382 Fib retracement support at $37,200.

Despite this bearish BTC price prediction, successfully reclaiming the $42,450 resistance can trigger a 14% increase to the next resistance at $49,000.
Read More: 9 Best Crypto Demo Accounts For Trading
KCS Creates Long Upper Wick
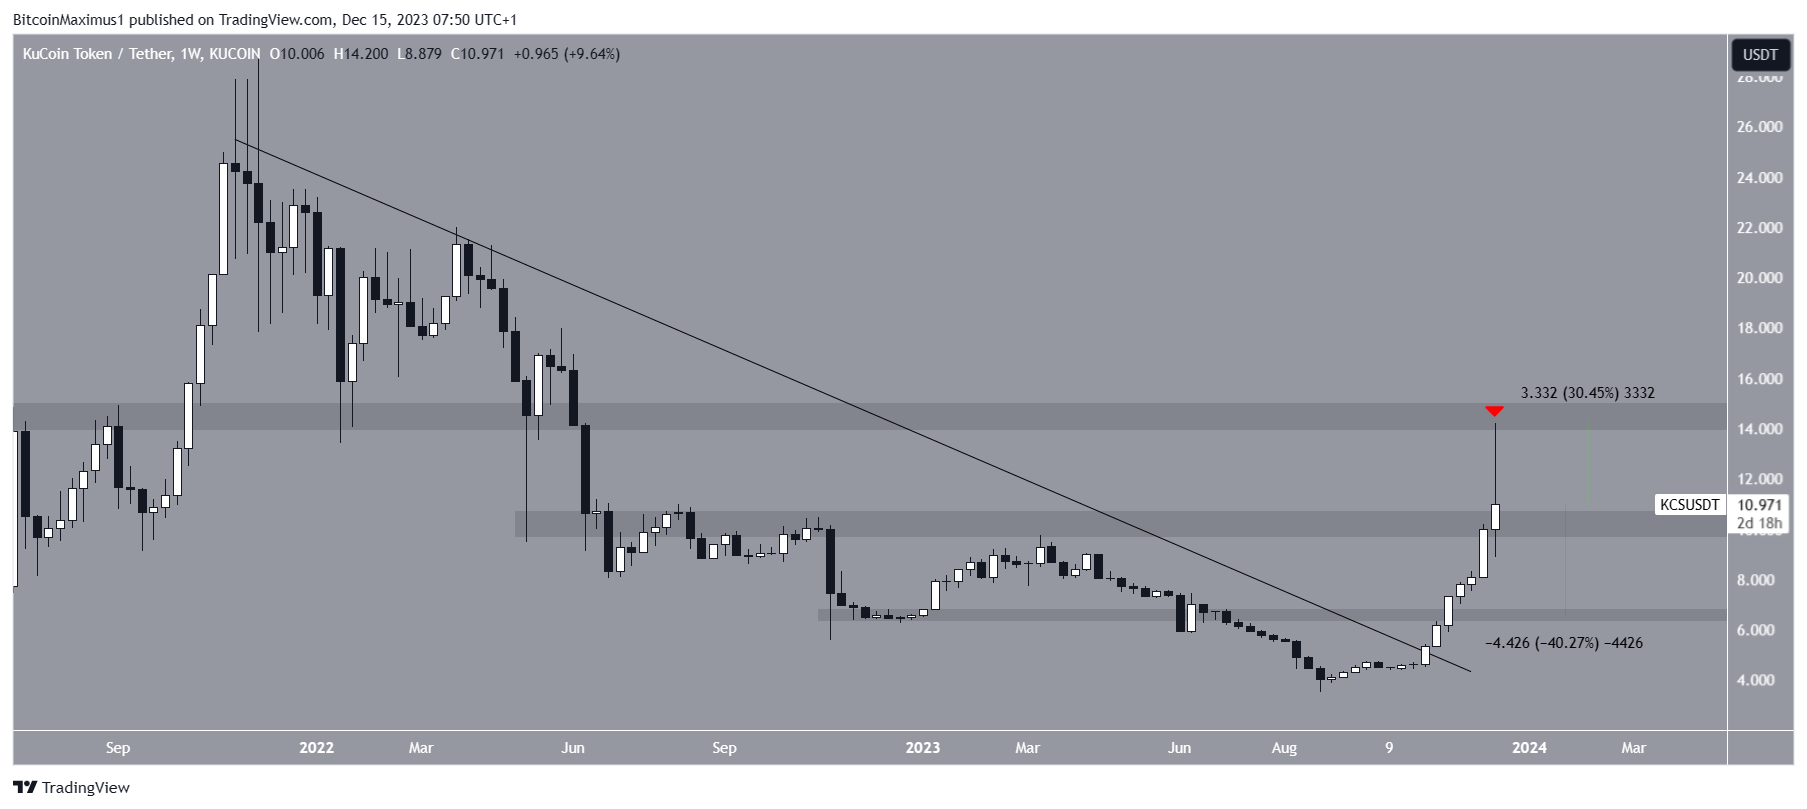
The KCS price has created seven successive bullish weekly candlesticks since breaking out from a long-term descending resistance trend line in October.
The upward movement led to a new yearly high of $14.20 on December 13. However, the KCS price was rejected shortly after the yearly high and created a very long upper wick (red icon), which validated the $14.50 area as resistance.
Also, the KCS price returned to the $10 horizontal area.
If the KCS price bounces at this support, it can increase by 30% and return to the $14.50 resistance.

On the other hand, a breakdown from the $10 area can trigger a 40% drop to the closest support at $6.50.
Read More: Best Upcoming Airdrops in 2023
For Bitnaz‘s latest crypto market analysis, click here.
Disclaimer
In line with the Trust Project guidelines, this price analysis article is for informational purposes only and should not be considered financial or investment advice. Bitnaz is committed to accurate, unbiased reporting, but market conditions are subject to change without notice. Always conduct your own research and consult with a professional before making any financial decisions.


